 Energy consciousness is at an all-time high, and scary home energy bills are one reason why. The good news is that we now have the tools and materials to do much more than just complain about how much it costs to deflect winter’s cold, cruel blasts. Infrared thermography offers the eyes to see where energy losses are actually occurring on your home and where new windows, expanding foam, and advanced weather stripping will do the most good. Thermal imaging tools are coming down in price rapidly, even to the point where simple units are now affordable by any homeowner.
Thinking of buying a new house? Market-savvy builders are now using infrared images to prove efficiency claims by lifting them out of the realm of faith and making them plainly visible. Have you just moved into a resale home and find that peak heating bills are higher than the mortgage? Applying an infrared audit of the sort offered by more and more home inspectors eliminates the mystery of exactly where all your heating dollars go.
Understanding the Ins and Outs of Infrared Thermography
To understand how infrared thermography works, you’ve got to realize something about what we see with our eyes. What we detect as visible light is actually a small part of what scientists call the electromagnetic spectrum. Energy with short wavelengths are the kind of ultraviolet radiation that inflicts sunburns and fades drapes. Energy wavelengths that are longer than what we see heats food in microwave ovens and delivers radio signals to our cars. Nestled between what we see and the wavelengths of energy that swells a bag of microwave popcorn is the infrared spectrum. Although it’s invisible, infrared energy radiation is what thermographic cameras show on screen, highlighting areas in the exterior surfaces of your home that offer the greatest potential for energy improvement.
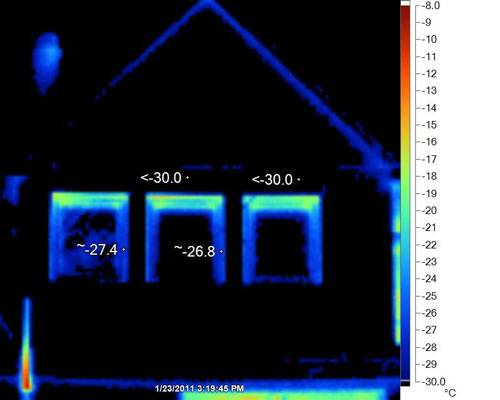
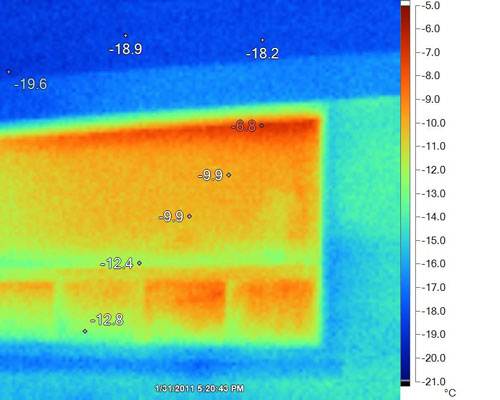
Winter is an excellent time to conduct a thermographic home audit because the differences in temperature indoors and outside are at their peak. The brighter the area of the thermographic image, the greater the amount of heat loss in that zone. Gradients of heat output are what a thermographic camera shows.
Windows, Walls, and Roofs: Infrared Detects Worry Spots Anywhere
 The lighter of the two images here show a 20-year-old window from the outside during winter. The numbers on the image show the surface temperature in ºC at that spot. The fact that the glass window surface is so much warmer than the surrounding walls proves that significant heat is being lost from inside. By contrast, the darker image shows how the surface temperature of a high performance window is virtually the same as surrounding walls. Thermography is also used to detect waterlogged areas in flat roofs, both residential and commercial. Since these structures are rarely vented, leaks can cause wetting of internal insulation that doesn’t dry out quickly or at all. Infrared thermography shows these zones as hot spots on warm summer evenings as wet sections continue to give off heat after dry areas have cooled.
Infrared Thermographical Tools
The least expensive way to make thermography a part of your home improvement work is with one of the new, compact and inexpensive infrared thermometers. They allow pinpoint measurement of surface temperatures remotely, from as far as 40 feet away. They won’t give you a complete photo image like you see here, but they will let you accurately find hot and cold spots that need attention. I’ve used the DeWALT, Milwaukee ($170) and Ryobi ($80) units in my work and they all perform very well.
While it may not be quite as useful as Superman’s X-ray vision, infrared thermography can let you see deficiencies that rob you of hard-earned cash while also taking an unnecessary toll on the environment. Shed light on the culprits, foil their hidden schemes, and we’re all better off for it.
Photos courtest of Reiner Hoyer, The Reno Coach